Ensemble Video Analytics and Reporting

You know it and we know it, online video is ubiquitous – used more and more by educators and publishers to enhance teaching, learning and communication. As the ever-increasing flow of video content in pumped into Ensemble Video implementations and consumed by viewers online, many uploaders ask the one question over and over.
Does Ensemble Video have Video Analytics and Reporting?
Ensemble Video is a leading online video platform and has included video reports for many years, but we recently revamped the entire reporting area. Why? We know our users want to make decisions based on real data, and leave speculation behind. Ensemble Video 3.7 includes built-in analytics and reports that provide you with the information and insight you need, to successfully manage your video content.
How should I use analytics?
Our video analytics reports give you huge amounts of data about your videos which can often be overwhelming. Before you start looking at all the information we offer, first decide what your goal is. Having a strategy will allow you to focus your attention on the most important data.
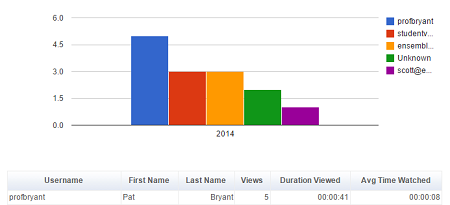
To give a couple of examples, you may be trying to figure out who is watching your videos and how long they are watching? In this case you would focus on the User Viewing Details Report. This report will tell you if a student or staff member has watched the video you recommend they watch.
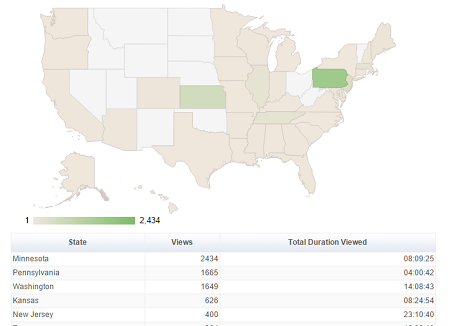
What if you just started a new online learning program and you want to see if your online learners across North America are viewing the content. In this case you would use the Geographic Popularity Report. You can drill down into the map to explore data by country, state, and city.
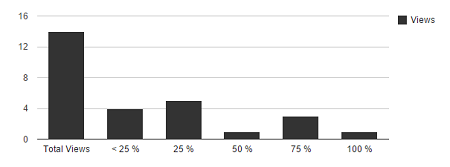
You also might want to figure out if your viewers are watching small portions of your video or the entire clip. In this case you would use the Percentage Viewed Report. This report will tell you if users are watching small percentages of long videos and large percentages of small videos. If you analyze those trends, you probably want to make shorter “video snacks.”
Our new Reporting area enables you to view a snapshot of high-level data, or drill down to user-specific and video-specific information. Additionally, you can modify the date range or the reporting data and export the reports to shareable file formats. The following reports are included in every Ensemble Video implementation:
Audience Reports
- Content Geographical Popularity – Represents content views by geographic location. Users can drill down into the map to explore data by country, state, and city.
- Browser – Represents the content views by web browser. Users can drill down into the pie chart to explore detailed statistics by browser version.
- Platform – Represents the content views by platform (Mac, Windows, IOS, and Android). Users can drill down into the pie chart to explore detailed information about which platform versions your viewers are using.
Content Reports
- Content Popularity – Allows users to explore how viewers interact with your media, including number of plays and duration of plays. The “Average Rating” and “Number of Comments” columns refer to Portal views (if applicable).
- Content Activity – Provides information on how internal users have interacted with media item. Entries appear on this report when users signed into your Ensemble Video account add, edit, or view your item.
- Percentage Viewed – Shows how many viewers watched specific portions (25%, 50%, etc.) of a video.
- Users Viewing Details – Allows you to see the total number of plays and time spent with your media items, overall.
System Reports
- Asset Storage – Provides an itemized breakdown of disk usage for non-video files, such as images.
- Media Storage – Provides an itemized breakdown of disk usage for video files.
- System Activity – Provides information on how internal users have interacted with your media item. Entries appear on this report when users signed into your Ensemble Video account add, edit, or view your item.
- Users – Allows you to view vital information about the Users in any Media Library (or all Libraries) within your Organization.
Why are analytics important?
Video Analytics in your video content management system is extremely important for a number of different reasons. The main reason being, once you understand your viewers’ behavior you can optimize your content to improve results. Going back to the example of long videos not being watched fully, you can quickly determine that making short videos will be more effective for you and your viewer. To put it simply, video analytics provide information to help you make educated changes based on actual data, as opposed to hypothesized ideas based on opinions. In a never-ending battle for engaged viewers, data is king. Ensemble Video’s video analytics area allows you to measure more than just views – discover what really drives viewers to your videos and keep them coming back for more.
Related Posts


-
 Ensemble Video Acquired by Panopto
We have big news here at Ensemble: we’re becoming...
- April 21, 2021
-
 Hybrid Classes: The New Normal for Higher Ed Educators & Students
Thanks to COVID, many college students and educators who...
- March 25, 2021
-
 Extron and Ensemble Video: Upgrade Your Lecture Capture and Meeting Capture
Ensemble Video’s new integration with Extron is an upgrade...
- February 25, 2021
-
 HOW TO: Convert DVD (VOB) Files to Editable MPEGs
One of the keys to developing a content rich...
- January 13, 2011
-
 HOW TO: Create Captions in YouTube for Ensemble Video
Joel Steinfeldt, Media Communications Specialist at the University of...
- May 31, 2010
-
 HOW TO: Livestream With Adobe FMS/FMLE
With Adobe Flash Media Server and Adobe Flash Media...
- December 5, 2010
You must be logged in to post a comment Login